How to Read and Analyze an Income Statement
How to Read and Analyze an Income Statement

Transform Your Financial Future
Contact UsIf you’re managing a business or personal finances, understanding your income statement is crucial, and waiting too long to analyze it can cost you. 42% of small business owners admit they had limited or no financial literacy before starting their businesses.
Your income statement isn’t just a list of numbers; it’s a direct reflection of your financial health. It tells you if your business is profitable, where you’re overspending, and how sustainable your revenue is. The sooner you master how to read and analyze it, the quicker you can spot problems and make smarter decisions.
In this article, we’ll walk through how to read and analyze an income statement, helping you make sense of the figures that matter most.
Key Takeaways
- Income Statement Analysis: A critical tool for assessing financial health, revealing profitability, cost efficiency, and revenue trends.
- Key Elements: Key components like revenue, gross profit, operating income, and net income provide a clear financial snapshot.
- Analysis Techniques: Vertical, horizontal, and ratio analyses help identify trends, cost inefficiencies, and areas for improvement.
- Financial Strategy: Income statement analysis informs budgeting, forecasting, and strategic financial decisions to drive business growth.
- Financial Insights: Regular analysis helps manage cash flow, attract investors, and optimize cost-effectiveness for long-term stability.
What is an Income Statement Analysis?
An Income Statement Analysis (also known as Profit and Loss Statement Analysis) is the process of reviewing and evaluating the information on a company’s income statement to assess its financial performance over a specific period.
The income statement itself provides a snapshot of a company's revenues, expenses, and profits or losses. Analyzing trends over multiple periods will help you identify patterns in profitability, cost management, and revenue growth.
Gaining insights into the business’s profitability, cost structure, and overall financial health is essential, but why should you analyze your income statement?
Why is Analyzing an Income Statement Important?
Analyzing your income statement is crucial for more than just tracking profits. It’s about understanding the full financial picture of your business, making decisions, and setting a strong foundation for future growth. Let’s look at why income statement analysis should be a regular part of your financial routine.
- Identifies Strengths and Weaknesses: Analyzing the income statement highlights areas of growth and spots inefficiencies. You can quickly address cost overruns or capitalize on strong revenue streams.
- Improves Budgeting and Forecasting: It provides data to create more accurate budgets and forecasts, ensuring you can plan for seasonal changes, anticipate expenses, and set realistic financial goals.
- Guides Financial Strategy: Understanding your profitability and expenses helps shape effective business strategies, whether it’s cutting costs, increasing sales, or refining operations.
- Cash Flow Management: By examining income and expenses, you can better manage cash flow, avoid liquidity issues, and maintain timely payments, keeping the business running smoothly.
- Attracts Investors and Lenders: A clear, well-analyzed income statement shows potential investors and lenders that your business is financially healthy, making them more likely to support you.
- Calculates Cost-Effectiveness: It uncovers areas where you may be overspending, allowing you to optimize costs and improve overall profitability.
Recognizing the benefits of income statement analysis is one thing, but to truly utilize these insights, you need to know what you're looking at. Every item on the financial document tells a story, and understanding each component is your key to gaining actionable analysis.
Understanding the Structure of an Income Statement: Key Elements Explained
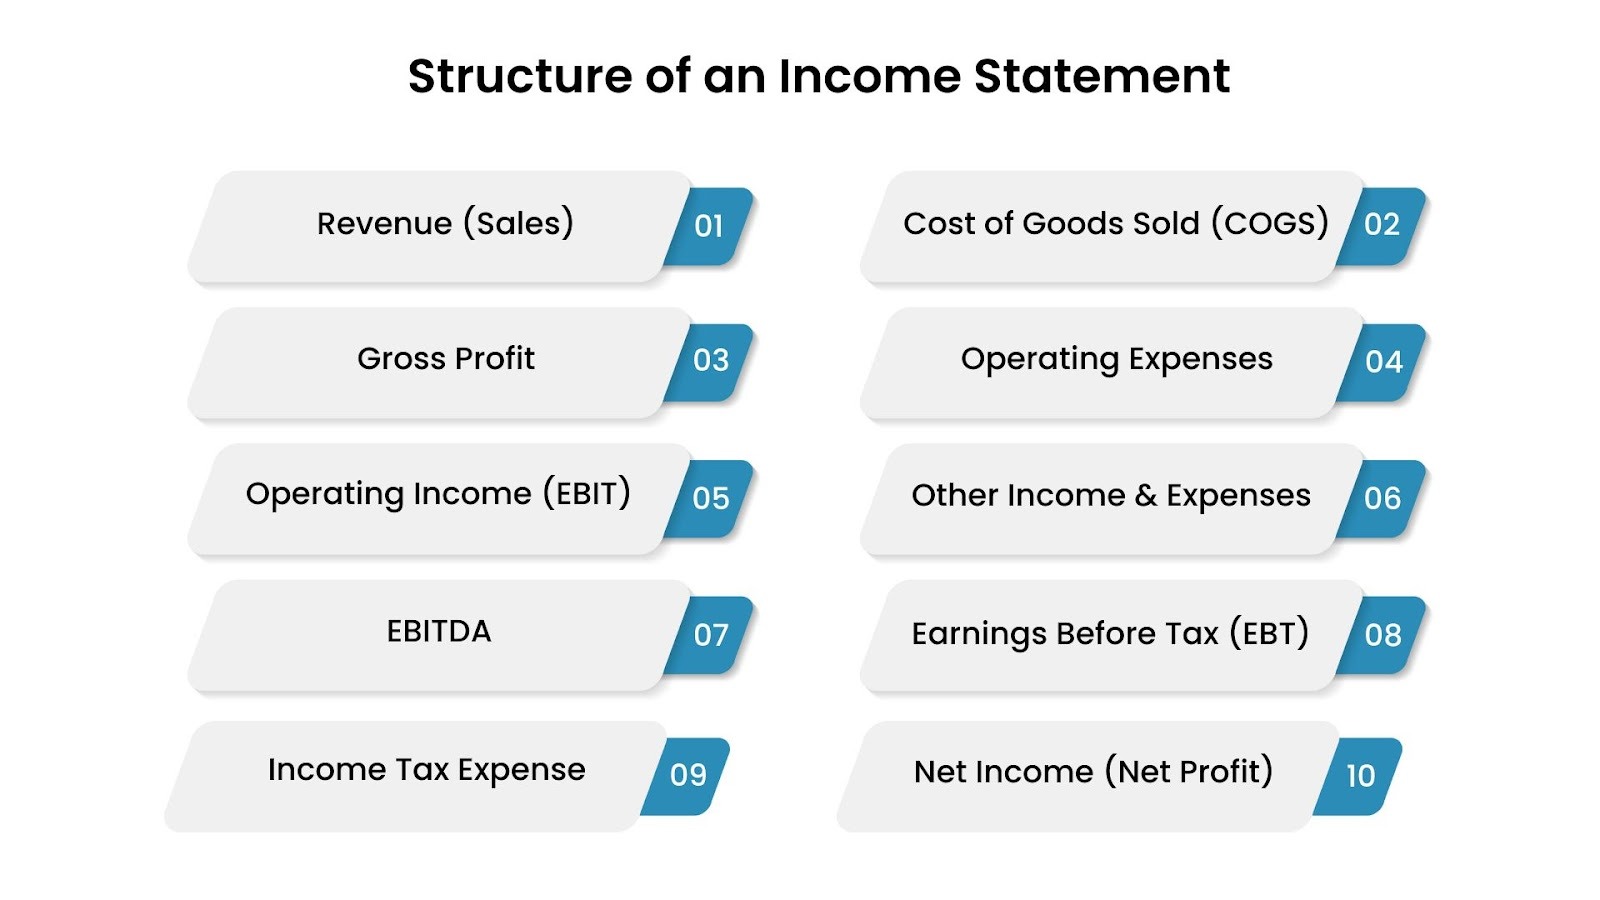
An income statement follows a clear structure that breaks down a company’s revenue, expenses, and profit over a given period. Understanding its structure is essential for performing income statement analysis and gaining a perspective on the financial health of the business.
The main elements that make up an income statement are:
1. Revenue (Sales)
This is the total amount of money a company earns from its business activities, such as selling products or services, during the period covered by the income statement.
2. Cost of Goods Sold (COGS)
COGS represents the direct costs of producing the goods or services sold by the company. This includes costs like raw materials, labor, and manufacturing expenses. Subtracting COGS from revenue gives you the gross profit.
3. Gross Profit
This is calculated by subtracting COGS from total revenue. It gives a clear view of how efficiently a company is producing and selling its products or services.
4. Operating Expenses
These are the costs associated with running the business on a day-to-day basis, excluding COGS. It includes categories like selling, general and administrative expenses (SG&A), marketing, rent, and utilities. Operating expenses are subtracted from gross profit to calculate operating income.
5. Operating Income (EBIT)
This is the profit a company makes from its core business operations, calculated by subtracting operating expenses from gross profit. It gives a better view of the company's operational efficiency before accounting for interest and taxes.
6. Other Income and Expenses
This includes any non-operating income or expenses, such as investment income, gains or losses from the sale of assets, or interest expenses. These are not related to the core business operations but can still affect profitability.
7. EBITDA (Earnings Before Interest, Taxes, Depreciation, and Amortization)
EBITDA is a metric that provides a clearer picture of a company’s operational profitability. It removes non-cash expenses like depreciation and amortization, along with interest and taxes, allowing analysts to focus purely on operational performance.
8. Earnings Before Tax (EBT)
This is the income earned before accounting for taxes. It’s calculated by adjusting operating income for any other non-operating income and expenses. EBT shows how much money the company has earned after covering all operational costs and interest.
9. Income Tax Expense
The amount a company must pay in taxes based on its earnings. This is subtracted from EBT to calculate the net income.
10. Net Income (Net Profit)
This is the final "bottom line" of the income statement. It’s the total profit after all expenses, including operating costs, taxes, and interest, have been deducted from revenue. Net income indicates the company's overall financial performance during the period.
Example:
Let’s say a company has the following figures for a particular period:
- Revenue (Sales): $10,000
- Cost of Goods Sold (COGS): $4,000
- Gross Profit: $10,000 - $4,000 = $6,000
- Operating Expenses: $2,500
- Operating Income (EBIT): $6,000 - $2,500 = $3,500
- Depreciation: $300
- Amortization: $300
Now, let’s calculate EBITDA:
- EBITDA: $3,500 (EBIT) + $300 (Depreciation) + $300 (Amortization) = $4,100
This shows the company’s earnings from its core operations before accounting for non-cash expenses like depreciation and amortization, as well as interest and taxes.
- Other Income (e.g., Interest): $200
- Earnings Before Tax (EBT): $3,500 + $200 = $3,700
- Income Tax Expense (20%): $3,700 × 20% = $740
- Net Income: $3,700 - $740 = $2,960
Also Read: How to Calculate Financial Freedom Number Using Passive Income Formula
You now know what each number on your income statement means. But how do you actually use this information to make better business decisions? Here are the proven techniques that turn these figures into actionable insights.
Income Statement Analysis Techniques: A Comprehensive Overview
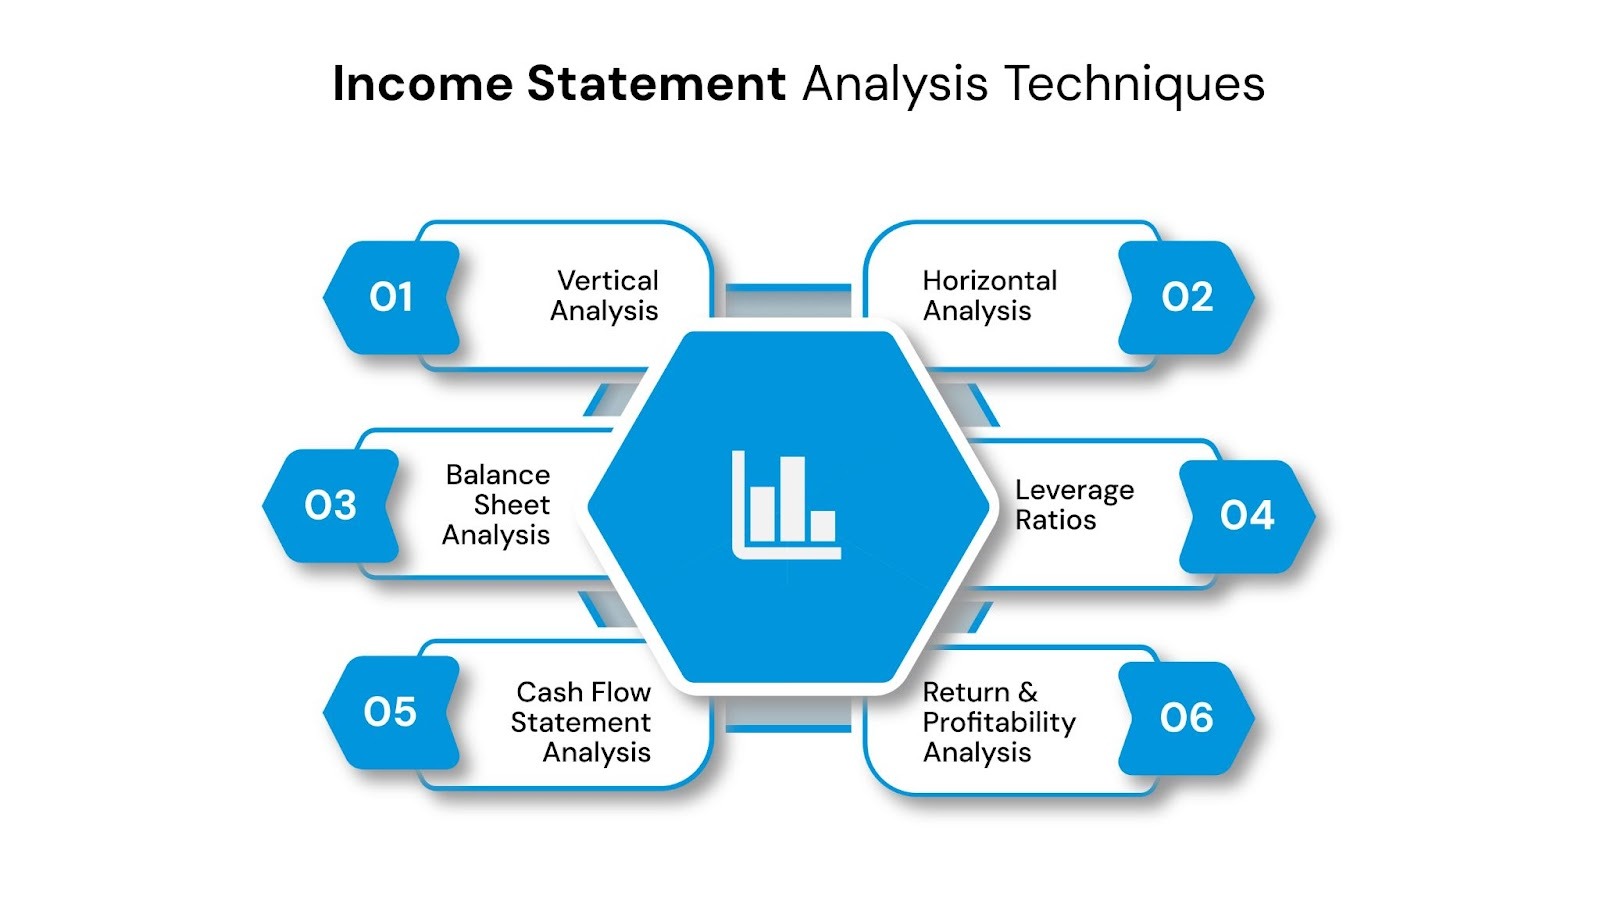
Financial statement analysis is key to understanding a company’s financial health and guiding strategic decisions. It helps identify trends, risks, and opportunities, ensuring financial stability.
For investors, it provides insight into profitability, liquidity, and debt management, building confidence in the company’s ability to generate returns and manage obligations.
Here are some common methods used to read and analyze an organization’s financial documents:
1. Vertical Analysis (Common-Size Analysis)
Vertical analysis involves expressing each line item in a financial statement as a percentage of a base figure within the same statement. In the income statement, each item is presented as a percentage of total revenue, allowing for easy comparison across companies and industries, irrespective of size.
Example:
Consider a company with the following income statement:
- Revenue: $500,000
- Cost of Goods Sold (COGS): $300,000
- Gross Profit: $200,000
In vertical analysis:
- COGS as % of Revenue: ($300,000 / $500,000) × 100 = 60%
- Gross Profit as % of Revenue: ($200,000 / $500,000) × 100 = 40%
This analysis reveals that 60% of the revenue is consumed by COGS, highlighting areas where cost control might be necessary.
2. Horizontal Analysis (Trend Analysis)
Horizontal analysis compares financial data over multiple periods to identify trends and growth patterns. It helps in assessing performance over time, detecting emerging problems, and projecting future performance.
Example:
Using the same company, let's compare the revenue over two years:
- Year 1 Revenue: $500,000
- Year 2 Revenue: $600,000
The horizontal analysis shows:
- Revenue Growth: (($600,000 - $500,000) / $500,000) × 100 = 20% increase
This indicates a positive growth trend, suggesting effective strategies or market conditions.
3. Balance Sheet Analysis
Balance sheet analysis evaluates a company's financial position by examining its assets, liabilities, and equity. It provides insights into liquidity, solvency, and capital structure.
Key Ratios:
- Current Ratio: Current Assets / Current Liabilities
- Quick Ratio: (Current Assets - Inventory) / Current Liabilities
- Debt-to-Equity Ratio: Total Debt / Total Equity
Example:
For a company with:
- Current Assets: $150,000
- Current Liabilities: $100,000
- Inventory: $50,000
- Total Debt: $200,000
- Total Equity: $300,000
Calculating the ratios:
- Current Ratio: $150,000 / $100,000 = 1.5
- Quick Ratio: ($150,000 - $50,000) / $100,000 = 1.0
- Debt-to-Equity Ratio: $200,000 / $300,000 = 0.67
These ratios indicate the company's ability to cover short-term obligations and its reliance on debt financing.
4. Leverage Ratios
Leverage ratios assess the degree to which a company is utilizing borrowed money (debt) to finance its operations and assets, indicating financial risk.
Key Ratios:
- Debt-to-Equity Ratio: Total Debt / Total Equity
- Debt-to-Assets Ratio: Total Debt / Total Assets
- Interest Coverage Ratio: EBIT / Interest Expense
Example:
For a company with:
- Total Debt: $500,000
- Total Equity: $500,000
- EBIT: $200,000
- Interest Expense: $50,000
Calculating the ratios:
- Debt-to-Equity Ratio: $500,000 / $500,000 = 1.0
- Debt-to-Assets Ratio: $500,000 / ($500,000 + $500,000) = 0.5
- Interest Coverage Ratio: $200,000 / $50,000 = 4.0
These ratios suggest a balanced use of debt, with a strong ability to cover interest expenses.
5. Cash Flow Statement Analysis
Cash flow statement analysis examines the inflows and outflows of cash within a company, categorized into operating, investing, and financing activities. It provides insights into liquidity and financial flexibility.
Key Metrics:
- Operating Cash Flow: Cash generated from core business operations
- Free Cash Flow (FCF): Operating Cash Flow - Capital Expenditures
- Cash Flow Margin: Operating Cash Flow / Revenue
Example:
For a company with:
- Operating Cash Flow: $100,000
- Capital Expenditures: $30,000
- Revenue: $500,000
Calculating the metrics:
- Free Cash Flow: $100,000 - $30,000 = $70,000
- Cash Flow Margin: $100,000 / $500,000 = 20%
A positive free cash flow indicates the company can reinvest in its operations or return value to shareholders.
6. Rates of Return and Profitability Analysis
This technique helps you break down a company’s performance into key areas. By using the “pyramid of ratios,” you can clearly see how well a business is generating profits, managing assets, and handling its financial risks.
In this section, we’re going to focus on some of the most important ratios you’ll apply to understand any business’s financial health.
- Return on Equity (ROE): ROE tells you how much profit a company is generating with the money invested by its shareholders. You can calculate ROE by dividing net income by shareholder equity.
- Profitability Ratios: These ratios focus on how much profit the company is making compared to its revenue. For example:
- Gross Profit Margin: Measures how much profit the company makes after subtracting the cost of goods sold.
- Operating Profit Margin: Looks at how much profit is left after covering operating expenses.
- Net Profit Margin: This is the final profit after all costs are deducted from revenue.
- DuPont Analysis:
The DuPont analysis is a way to break down ROE into three key factors:- Profit Margin: How much profit the company makes from its sales.
- Asset Turnover: How well the company uses its assets to generate revenue.
- Equity Multiplier: How much leverage the company uses to finance its assets.
With these analysis techniques and methods, businesses and investors can make decisions, identify strengths and weaknesses, and strategize for sustainable growth. Yet implementing these strategies consistently while managing day-to-day operations can be challenging, which is where specialized financial expertise becomes invaluable.
Forest Hill Management: Your Partner in Financial Freedom
Forest Hill Management is a trusted financial services provider dedicated to helping individuals and businesses achieve financial stability and freedom. With over 2 decades of experience, they specialize in managing past-due accounts and offering personalized financial solutions.
Key Services:
- Portfolio Management: Tailored plans to help you effectively manage outstanding financial obligations and work towards financial freedom.
- Portfolio Acquisitions: Assisting businesses burdened with delinquent accounts by providing relief and offering portfolio holders a fair opportunity to settle their obligations.
- Compliance & Technology: Ensuring your financial data is secure with advanced technology and strict adherence to industry regulations, maintaining confidentiality as you progress towards financial freedom.
Conclusion
Analyzing your income statement is not just about tracking profits but understanding the financial pulse of your business. By reviewing key elements like revenue, expenses, and net income, you can make data-driven decisions to improve profitability, manage costs, and align with long-term financial goals. Regular income statement analysis provides clarity for budgeting, forecasting, and financial strategy, while also attracting potential investors and lenders.
If you're looking to strengthen your financial management, Forest Hill Management offers expert services to guide you. Contact our financial advisors to create a custom plan tailored to your business needs.
FAQs
1. What is 3-statement analysis?
3 Statement Analysis refers to the analysis of a company's three core financial statements: the Income Statement, the Balance Sheet, and the Cash Flow Statement. This approach provides a comprehensive view of a company’s financial health, helping to identify the interdependencies between profitability, liquidity, and financial stability.
2. What is a good profit and loss ratio?
A good profit and loss ratio varies by industry, but generally, a profit margin of 10-20% is considered healthy for most businesses. A higher ratio indicates efficient operations and a strong ability to convert revenue into profit.
3. Is a 40% profit margin good?
Yes, a 40% profit margin is considered very good, especially for industries with higher costs of goods sold. This indicates that for every dollar of revenue, the company retains 40 cents as profit. It's an excellent sign of operational efficiency and profitability.
4. What is a 100% loss ratio?
A 100% loss ratio means that for every dollar of revenue, the company has incurred a dollar in losses. This typically indicates unsustainable financial operations, and the business is not making any profit. In industries like insurance, this would indicate the company is paying out claims equal to the premiums it receives.
5. What is an expense ratio?
The expense ratio is the proportion of a company’s revenue that is spent on operating expenses. It’s calculated by dividing total operating expenses by total revenue. A lower expense ratio indicates better efficiency, with more revenue being converted into profit.